Optical Coherence Tomography
Looking inside membrane fouling with optical coherence tomography (OCT)
Internal Imaging in Real-time
Optical coherence tomography (OCT) is an imaging technique that uses light scattering to show cross-sections of a 3D object (1). OCT has a resolution between 1 - 15 µm, which is about two orders of magnitude finer than traditional ultrasound (2). While this technique was originally developed for examining the human eye, OCT was quickly adapted to other areas of medicine and industry, including powerful applications in membrane technology (2, 3).
A New Tool for Membrane Technology
Membrane fouling is a major challenge for filtration technology as organic and inorganic build-ups significantly decrease filtration efficiency over time (4). A better understanding and visualization of the fouling process may lead to new solutions for improving filtration efficiency, which is where OCT comes in. Advantages of using OCT in membrane testing include fast scan rate, high resolution, and real-time imaging.
Traditional methods for characterizing membrane fouling include tracking fluctuations in the transmembrane pressure (TMP) or permeation flux and post hoc microscopy. Monitoring membrane properties provide data in real-time, but it does not give the full picture of processes at the membrane surface (4). Similarly, while microscopy gives a great deal of detail, it lacks information about formation dynamics and the cake layer may be disrupted in sample preparation (3, 4).
In applications for water treatment, including wastewater and desalination processes, OCT integrated filtration systems give information about membrane performance and biofouling dynamics. Some recent results from studies applying OCT to membrane filtration have revealed that fouling is not uniform across the membrane surface (3), and cake-layers consist of multi-layered structures (5). In a desalination study, fouling thickness was not correlated to resistance for three model foulants, showing that foulant/membrane specific interactions contribute to variations in performance (6).
How does it work?
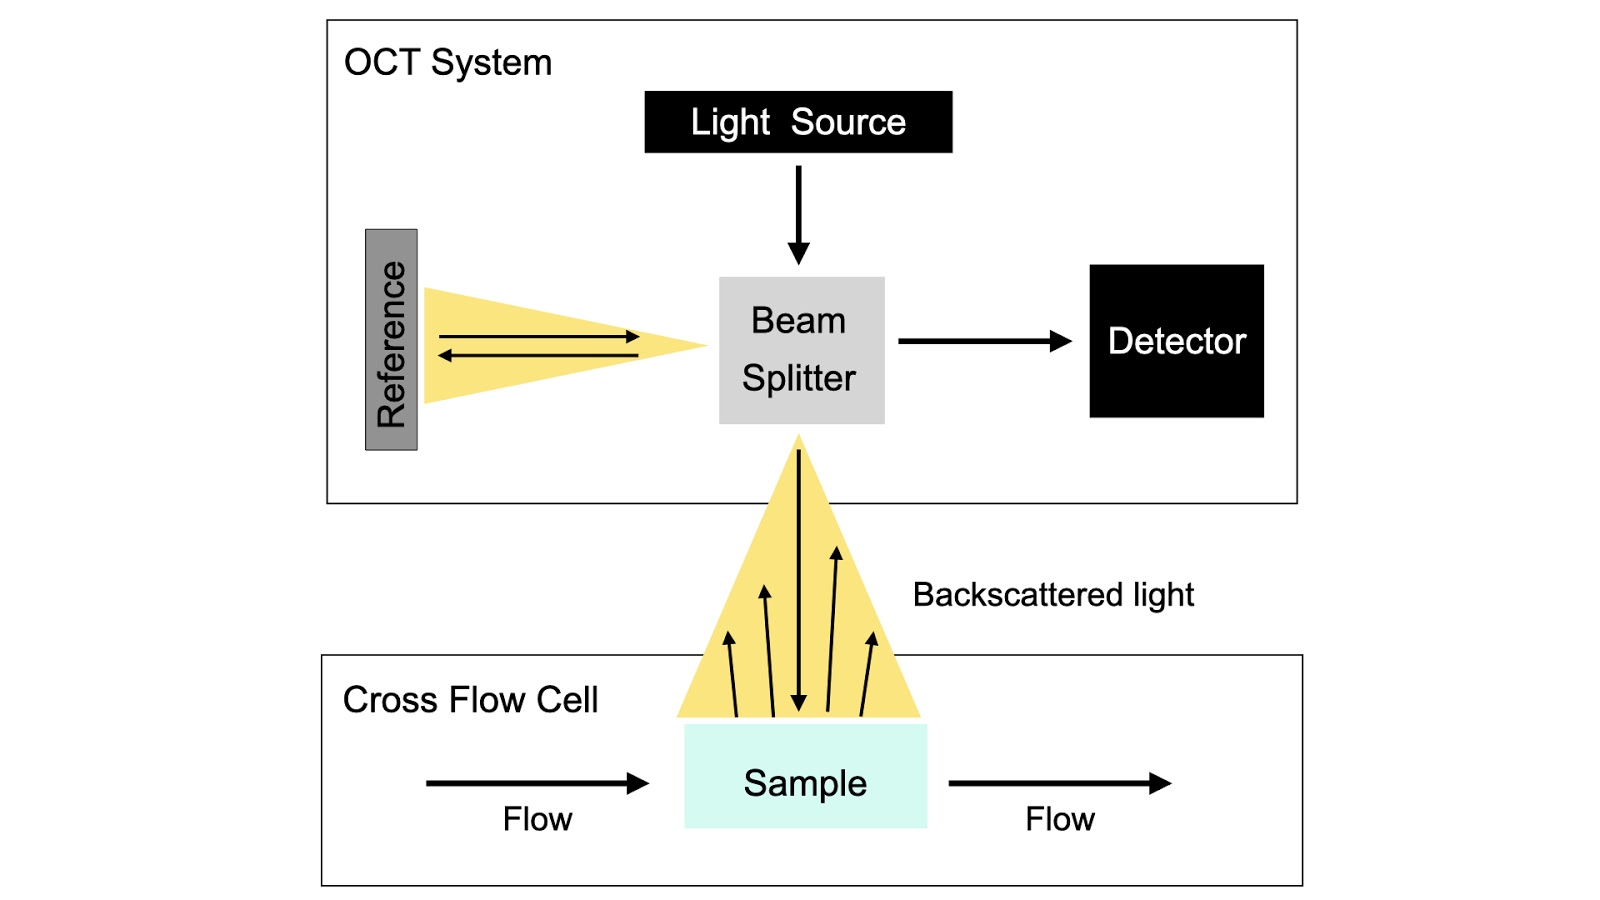
Optical coherence tomography produces cross-sectional images by measuring the backscattered or back reflected signal when a beam of light passes through a sample (7). Different structures in the sample cause a delay, called echo time, in light reflecting to the detector. The echo time is correlated to the dimensions of the internal structures (7). Low-coherence interferometry is an optical sensing technology that compares the data from backscattered light through the sample with a reference beam of known path length and echo time (7). 2D images obtained by OCT can be rendered into 3D time series for better depth visualization (8).
Diagram

Using OCT with Sterlitech acrylic filtration units and custom test skids
Custom designed Sterlitech Skid Mounted Membrane Filtration Systems give operators in research and industry control over a wide range flow parameters and features. Skids are regularly applied to applications in reverse osmosis, forward osmosis, ultrafiltration, nanofiltration, and microfiltration. Sterlitech Skid Mounted Membrane Filtration Systems support membrane innovations via OCT with a line of transparent filtration units. Sterlitech acrylic Sepa, CF042, and CF016 cross flow cells offer greater security and control for monitoring fouling dynamics. In contrast to hard plastic and stainless steel models, an acrylic cell body may be used in conjunction with OCT, and is capable of performing at pressures up to 400 psig and 88 oC.
Membrane filtration provides fresh water through sustainable desalination, supports community health by effective water treatment, and protects the environment with safe wastewater treatment. Optical coherence tomography gives a new lens to the dynamics of fouling processes on membrane efficiency and has the potential to improve access to fresh water resources around the globe.
References
- Huang D, Swanson EA, Lin CP, Schuman JS, Stinson WG, Chang W, et al. Optical coherence tomography. Science 1991 Nov 22;254(5035):1178.
- Popescu DP, Choo-Smith LP, Flueraru C, Mao Y, Chang S, Disano J, et al. Optical coherence tomography: fundamental principles, instrumental designs and biomedical applications. Biophys Rev 2011 Sep 3; 3(155) https://doi.org/10.1007/s12551-011-0054-7
- Yiben G, Haavisto S, Li W, Tang CY, Salmela J, Fane AG. Novel Approach To Characterizing the Growth of a Fouling Layer during Membrane Filtration via Optical Coherence Tomography. Environ. Sci. Technol. 2014 Nov 7; 48(24):14273014381.
https://doi-org.ezproxy.ub.gu.se/10.1021/es503326y - Li W, Liu X, Wang Y, Chong TH, Tang CY, Fane AG. Analyzing Evolution of Membrane Fouling via a Novel Method Based on 3D Optical Coherence Tomography Imaging. Environ. Sci. Technol. 2016 Jun 8; 50(13): 6930-6939.
https://doi-org.ezproxy.ub.gu.se/10.1021/acs.est.6b00418 - Fortunato L, Jeong S, Leiknes T. Time-resolved monitoring of biofouling development on a flat sheet membrane using optical coherence tomography. Sci Rep 2016 Feb 7; 7(15).
https://doi.org/10.1038/s41598-017-00051-9 - Park J, Lee S, You J, Park S, Ahn Y, Jung W, et al. Evaluation of fouling in nanofiltration for desalination using a resistance-in-series model and optical coherence tomography. Sci. Total Environ. 2018; 642:349-355
https://doi.org/10.1016/j.scitotenv.2018.06.041 - Fujimoto JG, Pitris C, Boppart SA, Brezinski ME. Optical coherence tomography: an emerging technology for biomedical imaging and optical biopsy. Neoplasia 2000 Jan 2; 2(1-2): 9-15. Neoplasia. 2000;2(1-2):9‐25.
https://doi.org/10.1038/sj.neo.7900071 - Fortunato L, Leiknes T. In-situ biofouling assessment in spacer filled channels using optical coherence tomography (OCT): 3D biofilm thickness mapping. Bioresour. Technol. 2017 April; 229: 231-235
https://doi.org/10.1016/j.biortech.2017.01.021


